Introducing Your Creator Analytics Dashboard
Views, impressions, conversion, traffic sources — your new analytics dashboard shows exactly what's driving your sales, and what isn't.
· 5 min read · product updates

For too long, selling online has felt like shouting into the dark. You post, you wait, and a sale appears — but you rarely know why. Today that changes. The new Creator Analytics Dashboard gives you a clear, honest view of how your store and products are really performing.
From impression to sale
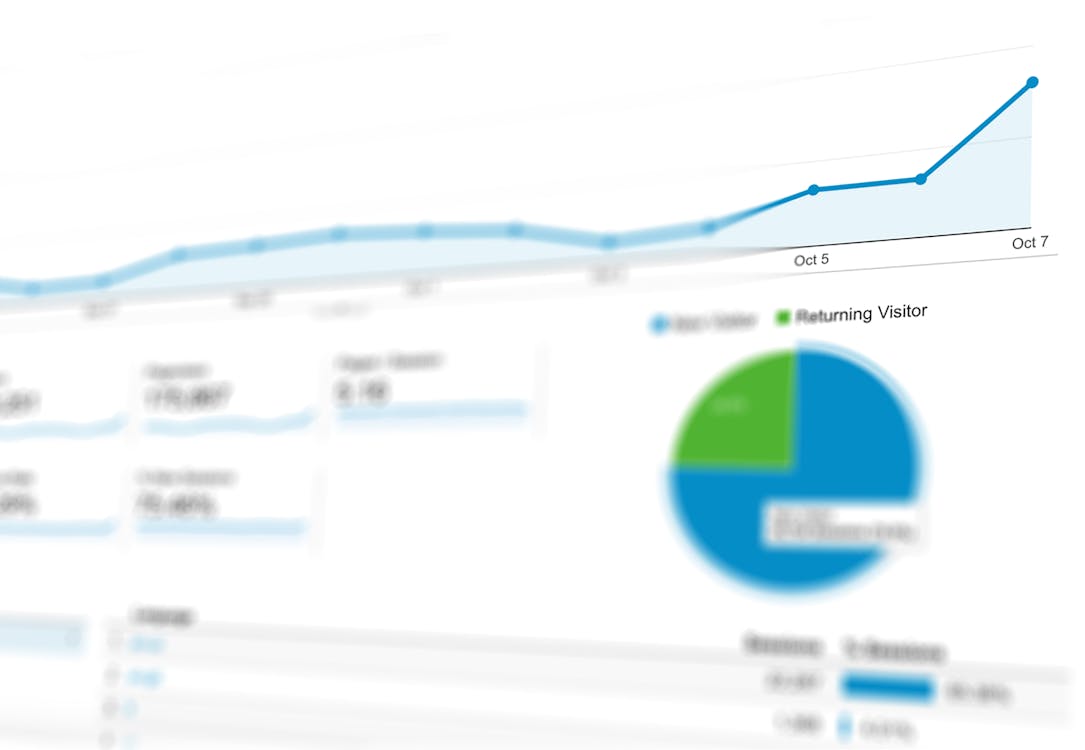
For every product you can now see impressions (how often it appeared), views (how often someone opened it), and how those turn into sales. When views are high but sales are low, your price or description needs work. When impressions are low, you need more reach. The numbers tell you exactly where to focus.
See where your buyers come from
The new Traffic Sources view breaks down which channels actually drive visitors — Instagram, WhatsApp, your link-in-bio, or direct. Now you can stop spreading yourself thin and double down on the platforms that genuinely convert.
Profile analytics, too
Beyond products, you can see how your store profile performs: profile views, social-link clicks, and store-link clicks. If lots of people view your profile but few click through to a product, your bio and storefront need a sharper hook.
Make this week's decision with data
Pick one number this week — your view-to-sale rate, say — and try to improve it. Better screenshots, a sharper title, a fairer price. Then watch the dashboard tell you whether it worked.
Your analytics are live now. Open your dashboard and meet the most useful tool you'll check every morning.
Start selling digital products in India on MintLink — sell with UPI, get paid weekly.